Data Visualization & Dashboards
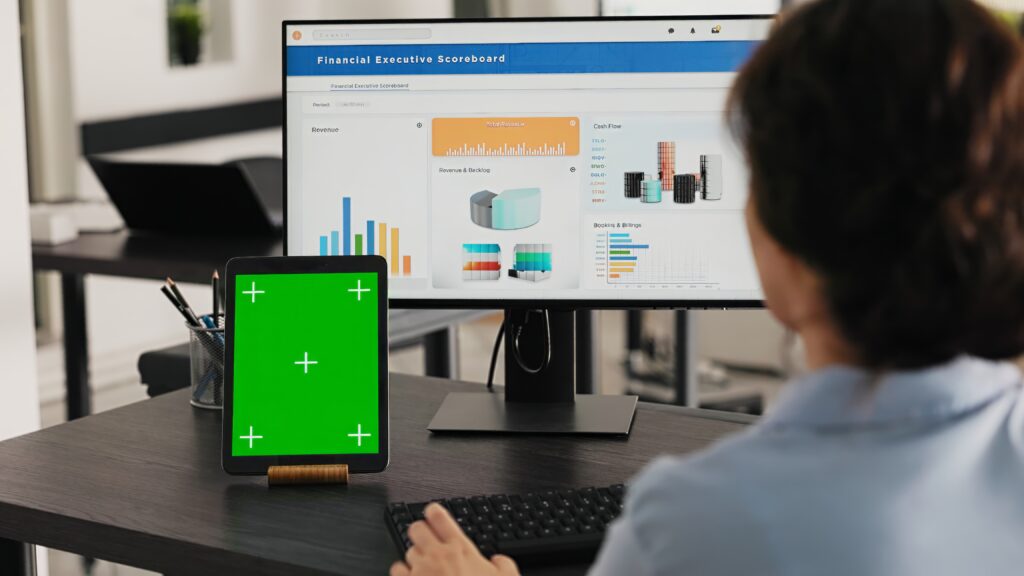
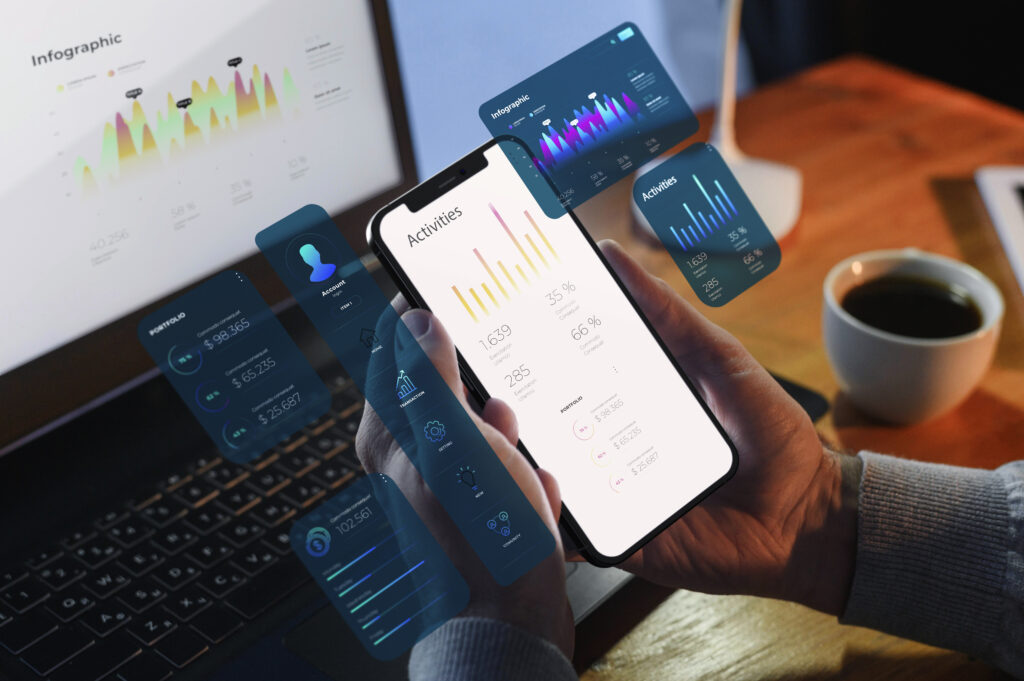
Turn raw data into actionable insights with custom dashboards and visual analytics that empower smarter business decisions.

Overview
Trexo helps businesses transform complex datasets into clear, interactive dashboards that highlight what really matters. We integrate multiple data sources into a single platform, giving leaders the power to track KPIs, spot trends, and make data-driven decisions faster. Our dashboards are designed for clarity, usability, and real-time insights, ensuring teams always stay one step ahead.
Why Choose Us?
Custom Dashboards – Tailored for your business KPIs and goals.
Real-Time Insights – Live data tracking for fast decision-making.
Interactive Visuals – Easy-to-understand charts, graphs, and reports.
Scalable Solutions – From startups to enterprises, we build dashboards that grow with you.
WHAT WE DO
Our Services

Custom Dashboard Development
Build dashboards tailored to your KPIs.

Business Intelligence (BI) Integration
Power BI, Tableau, Looker, and more.

Real-Time Data Monitoring
Live updates from multiple sources.

Data Warehousing & Integration
Connect data from CRMs, ERPs, and APIs.

Advanced Analytics & Reporting
Predictive trends and in-depth analysis.

Mobile-Friendly Dashboards
Access insights anytime, anywhere.
Our Development Process
Requirement Analysis
Identify KPIs and business goals.
Data Integration
Connect databases, APIs, and platforms.
Design & Development
Build visually engaging dashboards.
Testing & Refinement
Ensure accuracy and usability.
Deployment & Training
Launch with team onboarding.
Let’s build dashboards that make your data clear, powerful, and actionable.
